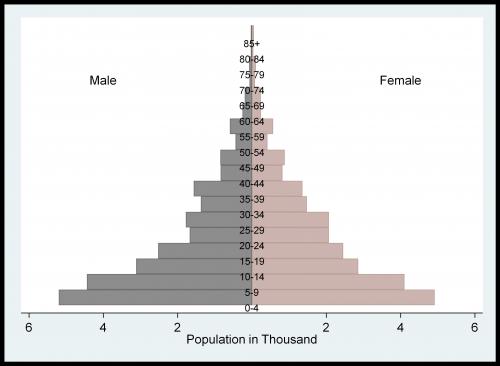
The Kersa catchment is attached to the Kersa HDSS, which was established in 12 sub-districts of Kersa district, Eastern Hararghe, Oromia Region, Ethiopia. The site is principally rural with three small towns (Kersa, Weter and Langhe). The baseline census was conducted in 2007 and since then has been updated every six months, with registration of demographic and health events. At the baseline a total of 10,085 houses, 10,522 households and 50,830 people were registered in 12 kebeles. The sex ratio and number of persons per household was 1.0 and 5.1, respectively. However, the number of kebeles in Kersa HDSS increased from 12 to 24 since 2015. At the end of 2015 the population was 116,325. Until the end of 2015, 217,819 births and 4,475 deaths were registered, respectively. Over 85% of births and deaths occurred at home. The annual net population growth ranges from -0,1 to 1.6. Meanwhile, the population growth rate ranged 1.63 to 2.94. The majority of the population in Kersa is not working; hence the dependency ratio in most of the years is below 1 which ranged from 0.88 to 0.98. The young population dependency ration is the highest (0.88) as compared with the old dependency ratio (0.05). The Total Fertility Rate ranges from 3.5 to 5.3. A reduction in neonatal, infant and under five mortality was observed. For all deaths, verbal autopsies were done. Infectious disease such as diarrhea diseases, and respiratory tract infections are the leading cause of death among adults while malnutrition is the leading cause of death among children under five years.
Population of Kersa Catchment area
|
Period |
Male |
Female |
Total |
Under5Age |
Birth |
Death |
Females (15-49) |
|
2007 |
|
|
|
|
|
|
|
|
2008 |
25,528 |
25,144 |
50,672 |
9,475 |
1,616 |
568 |
11,119 |
|
2009 |
26,206 |
25,747 |
51,952 |
9,167 |
1,795 |
486 |
11,499 |
|
2010 |
27,258 |
26,720 |
53,978 |
9,046 |
2,009 |
559 |
12,022 |
|
2011 |
29,015 |
28,473 |
57,488 |
8,859 |
1,578 |
657 |
13,124 |
|
2012 |
29,492 |
28,954 |
58,447 |
8,265 |
1,811 |
562 |
13,413 |
|
2013 |
30,282 |
29,656 |
59,938 |
8,384 |
2,340 |
506 |
13,918 |
|
2014 |
31,257 |
30,575 |
61,833 |
9,064 |
2,229 |
526 |
14,415 |
|
2015 |
50,083 |
48,849 |
98,932 |
15,473 |
3,121 |
822 |
22,533 |
|
2016 |
65,899 |
64,210 |
130,109 |
19,935 |
3,848 |
844 |
29,424 |
|
2017 |
66,996 |
65,080 |
132,076 |
19,953 |
4,487 |
743 |
30,071 |
|
2018 |
68,376 |
65,980 |
134,356 |
20,235 |
4,502 |
800 |
29,938 |
|
2019 |
69,659 |
66,991 |
136,650 |
19,931 |
3,465 |
810 |
30,989 |
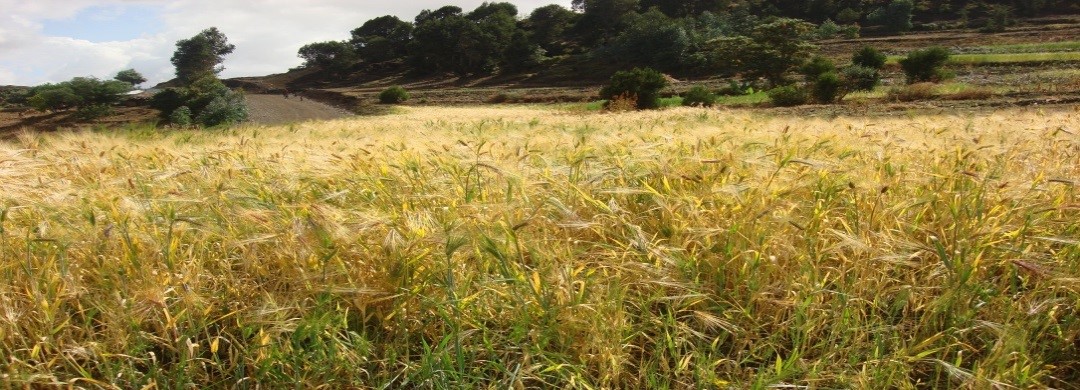
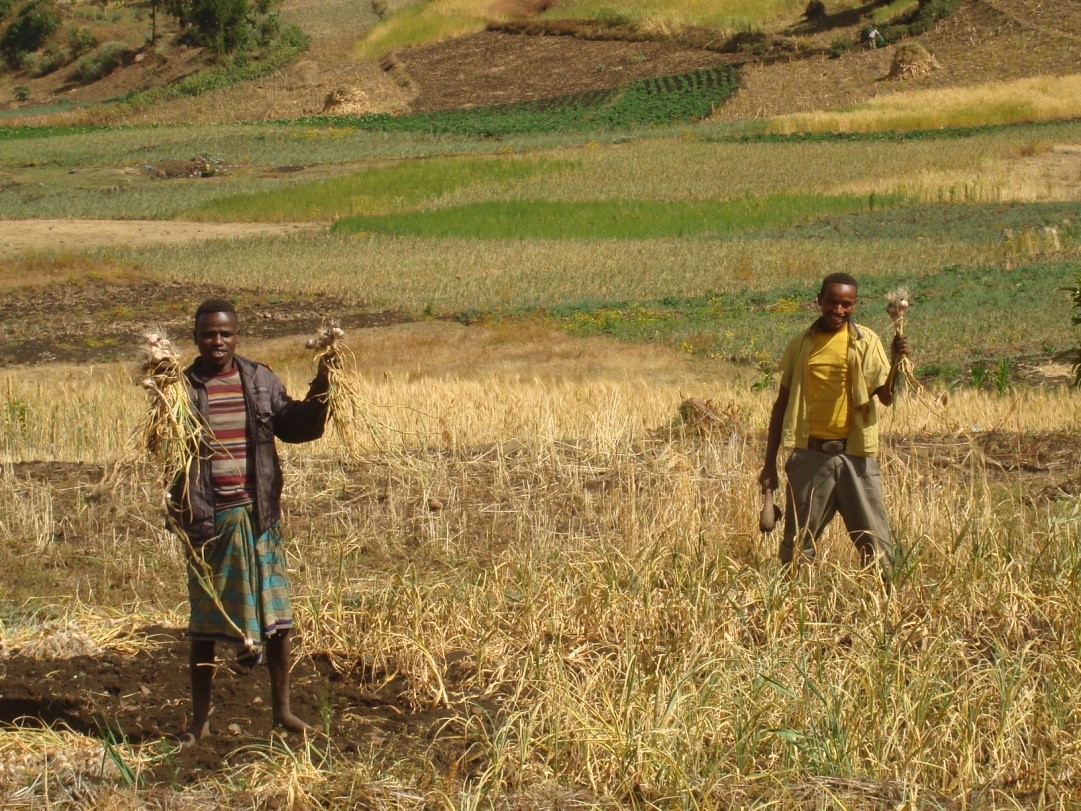
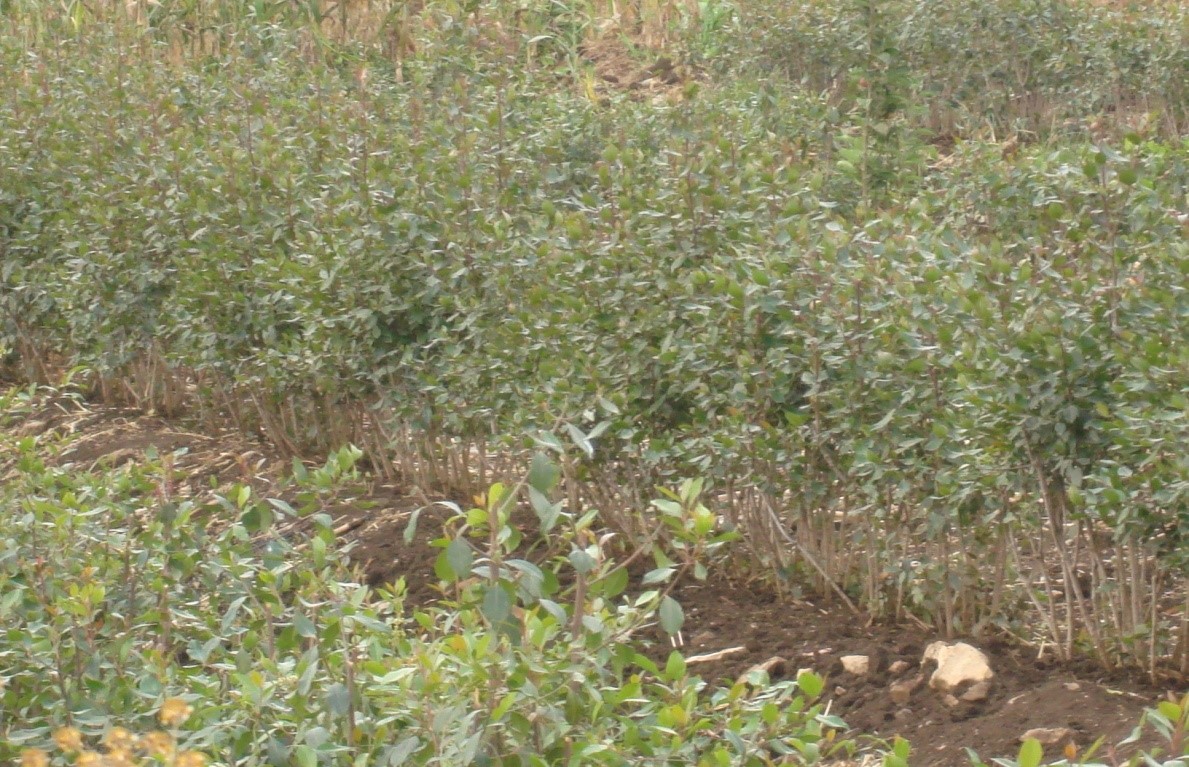
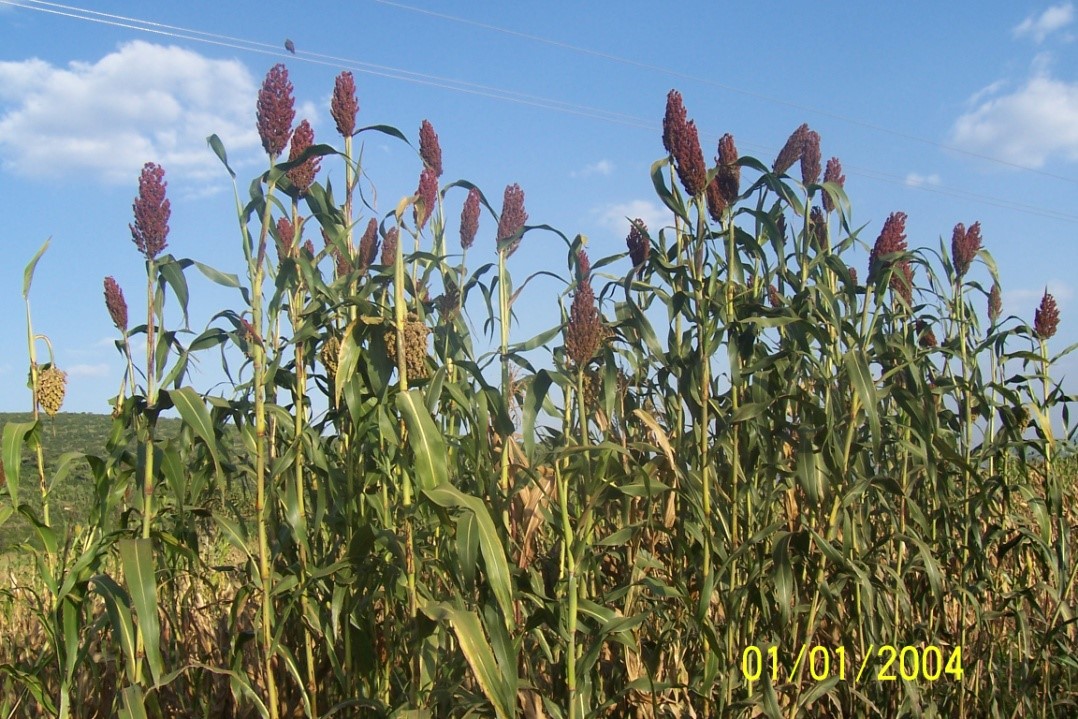
The images below depicts farm production in Kersa aeas