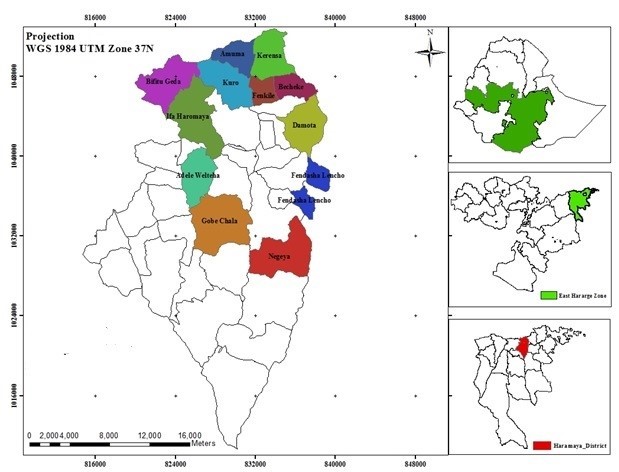
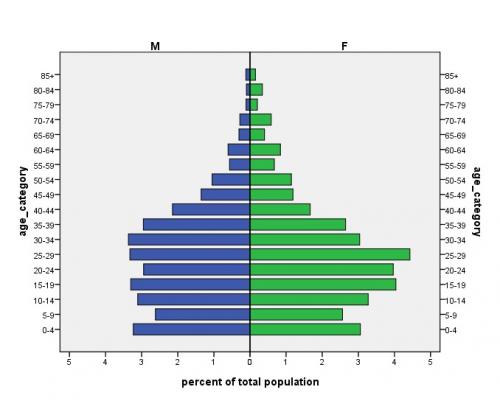
Haramaya Health and Demographic Surveillance System (HDSS) was established in Haramaya district located in the East Hararghe, Oromia, Eastern Ethiopia. It includes 12 kebeles (sub-districts) in the district. Most of these kebeles are midland ranging in an altitude of 1600-2100 meters above sea level. The area has 6 health centres and 12 health posts. A baseline enumeration of the site was done in 2018 and first-round event registration started in January 2019. At the bassline, the total number of households in the HDSS is 17461 and the total population was 99,898, with 23.86% of them were women of reproductive age. The young dependency ratio is 98.9, while the old dependency ratio is 2.64. The main means of livelihood in the area is farming. The HDSS site has a great opportunity of associating with Kersa HDSS, its location close to Haramaya University.
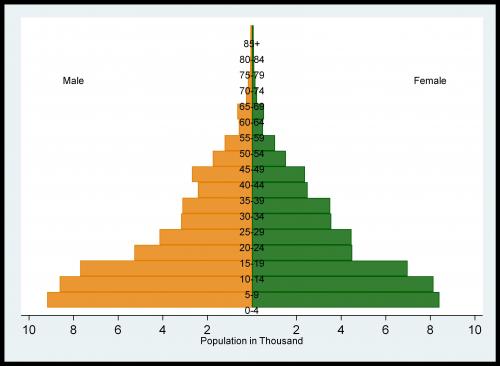
The Kersa catchment is attached to the Kersa HDSS, which was established in 12 sub-districts of Kersa district, Eastern Hararghe, Oromia Region, Ethiopia. The site is principally rural with three small towns (Kersa, Weter and Langhe). The baseline census was conducted in 2007 and since then has been updated every six months, with registration of demographic and health events. At the baseline a total of 10,085 houses, 10,522 households and 50,830 people were registered in 12 kebeles. The sex ratio and number of persons per household was 1.0 and 5.1, respectively. However, the number of kebeles in Kersa HDSS increased from 12 to 24 since 2015. At the end of 2015 the population was 116,325. Until the end of 2015, 217,819 births and 4,475 deaths were registered, respectively. Over 85% of births and deaths occurred at home. The annual net population growth ranges from -0,1 to 1.6. Meanwhile, the population growth rate ranged 1.63 to 2.94. The majority of the population in Kersa is not working; hence the dependency ratio in most of the years is below 1 which ranged from 0.88 to 0.98. The young population dependency ration is the highest (0.88) as compared with the old dependency ratio (0.05). The Total Fertility Rate ranges from 3.5 to 5.3. A reduction in neonatal, infant and under five mortality was observed. For all deaths, verbal autopsies were done. Infectious disease such as diarrhea diseases, and respiratory tract infections are the leading cause of death among adults while malnutrition is the leading cause of death among children under five years.
Population of Kersa Catchment area
Period
Male
Female
Total
Under5Age
Birth
Death
Females
(15-49)
2007
2008
25,528
25,144
50,672
9,475
1,616
568
11,119
2009
26,206
25,747
51,952
9,167
1,795
486
11,499
2010
27,258
26,720
53,978
9,046
2,009
559
12,022
2011
29,015
28,473
57,488
8,859
1,578
657
13,124
2012
29,492
28,954
58,447
8,265
1,811
562
13,413
2013
30,282
29,656
59,938
8,384
2,340
506
13,918
2014
31,257
30,575
61,833
9,064
2,229
526
14,415
2015
50,083
48,849
98,932
15,473
3,121
822
22,533
2016
65,899
64,210
130,109
19,935
3,848
844
29,424
2017
66,996
65,080
132,076
19,953
4,487
743
30,071
2018
68,376
65,980
134,356
20,235
4,502
800
29,938
2019
69,659
66,991
136,650
19,931
3,465
810
30,989
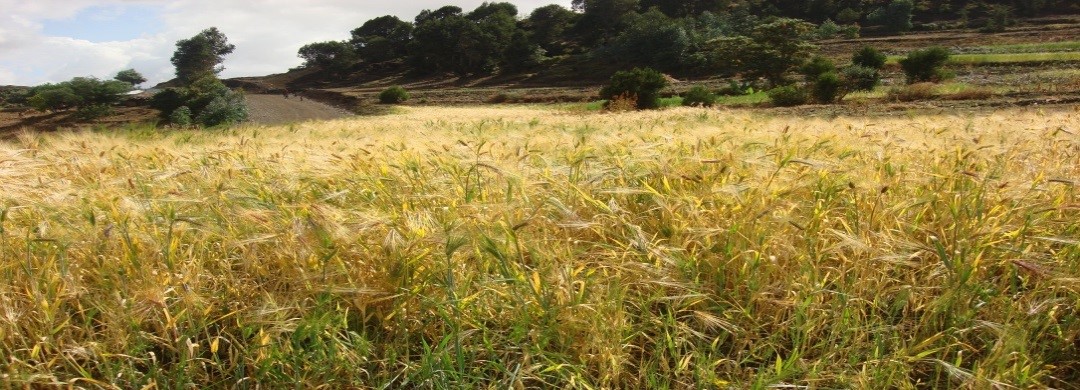
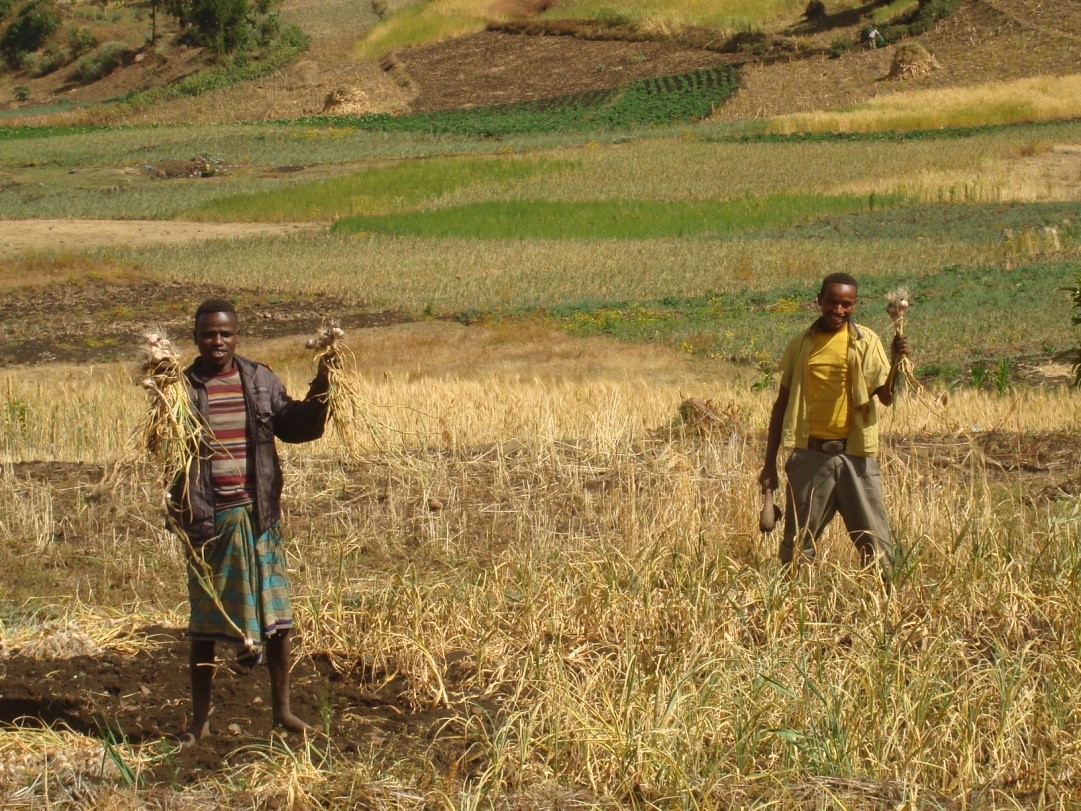
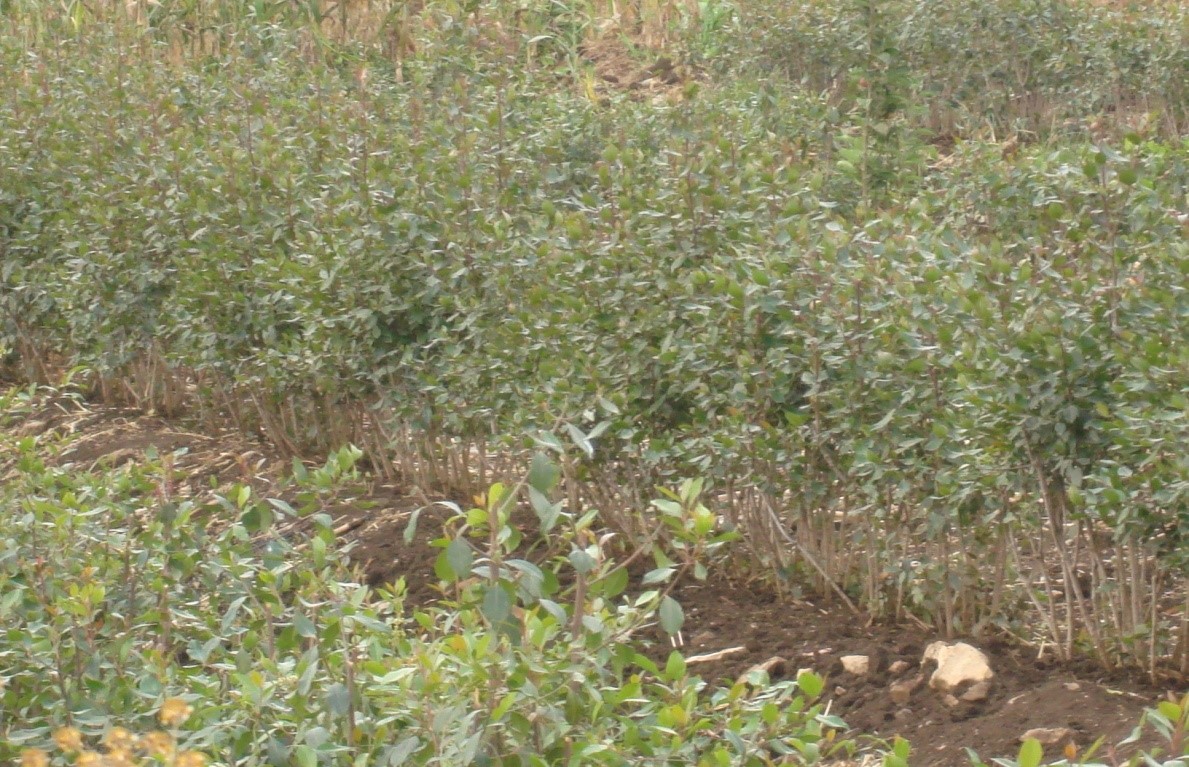
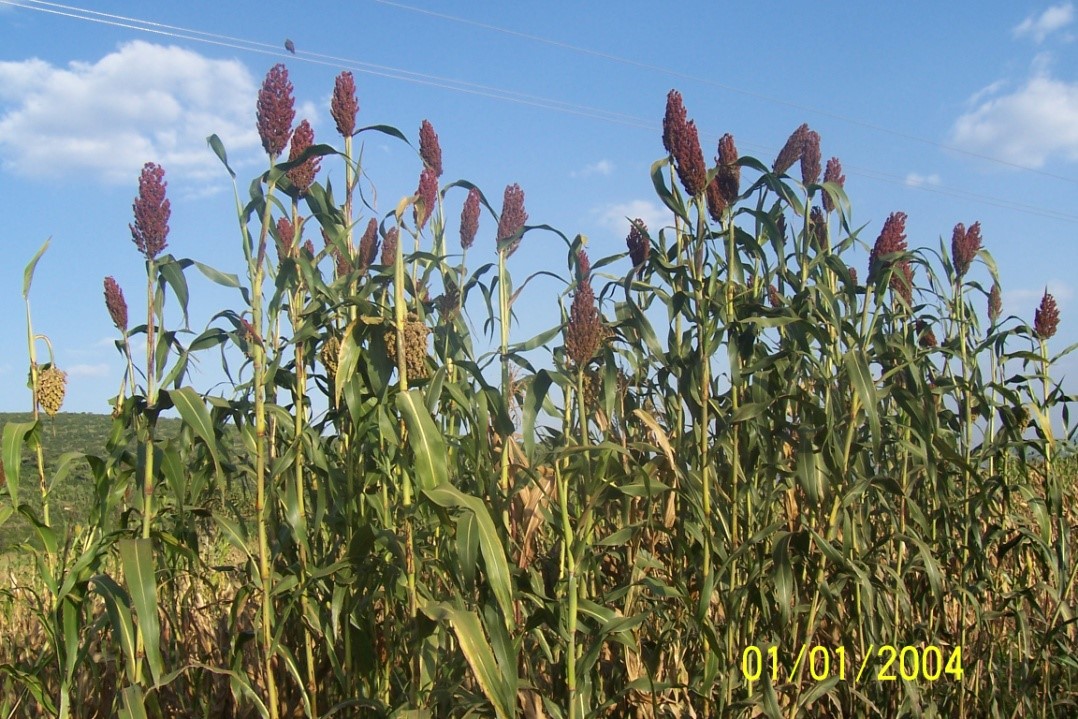
The images below depicts farm production in Kersa aeas
Wheat and barley, the dominant crops for food production around Tolla and GolaBelina KebelesVegetables are also common production around highland areas, here the farmers are working in garlic farm.Khat is the main crop produced for cash in many of the mid-land and low land areas of the study site.Sorghum, the dominant crop for food production in many of the mid land and low land areas of the study site
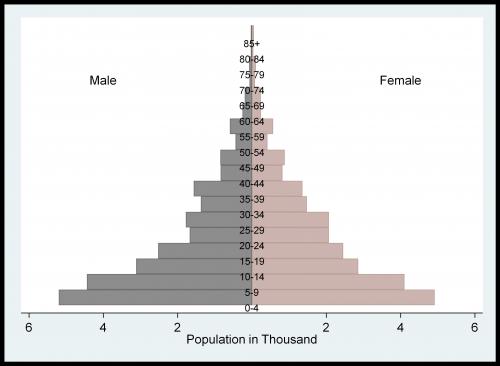
The Harar CHAMPS catchment is attached to the Harar Urban HDSS, which was established in 6 sub-districts among 19 urban sub-districts of in the city of Harar, Harari People National Regional State, Ethiopia in July 2011. Later addition six Kebeles were added in 2015 to make the total catchment Kebeles to be 12. A baseline population and housing census that covered the selected six kebeles was conducted in September 2012, and follow up of the demographic and health related events started soon after the census. The total population of Harar urban DSS site at the baseline was 32,437 residents. Of these, 15,579(48%) were males, and the remaining 16,858(52%) were females. Women of child bearing age account for 10,069 (31%) of the total population. The finding indicates an overall sex ratio of 92.4% males per 100 females.In general, the age structure of the Harar urban DSS population indicates the presence of high dependency ratio (the ratio between non-working and working population) (49.1%). Almost half (50%) of the population in Harar urban DSS were dependent over the working group (aged 15-64 years). In the meantime, young population dependency ratio was 0.46, and old dependency ratio was 0.07. The Total Fertility Rate ranges from 1.29 to 3.49. Neonatal, post neonatal, infant and under five mortality rates were observed below 10 per 1000 population.
Population of Harar Catchment Area
Year
Male
Female
Total
Under5Age
Birth
Death
Females
(15-49)
2012
2013
14,835
16,225
31,060
2,981
633
149
18,299
2014
15,004
16,531
31,536
3,067
577
148
18,506
2015
20,487
22,740
43,228
4,301
784
213
25,146
2016
27,848
30,815
58,664
5,718
934
259
33,794
2017
27,468
30,427
57,896
5,325
871
307
33,299
2018
27,350
30,228
57,579
5,170
837
275
33,241
2019
27,493
30,455
57,948
5,000
665
308
33,958
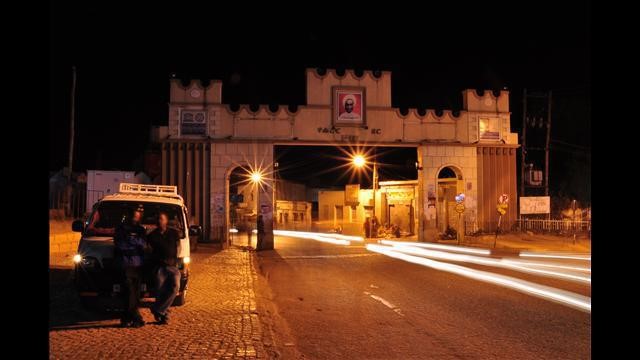
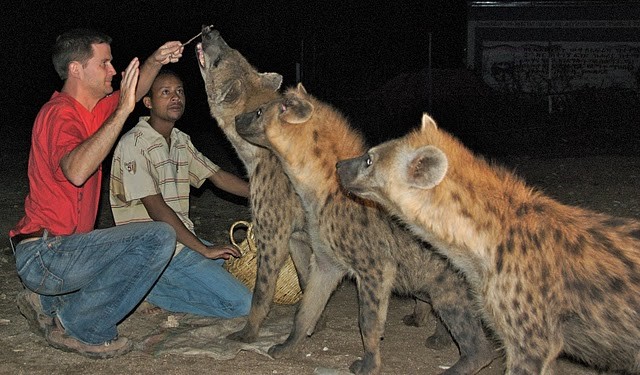
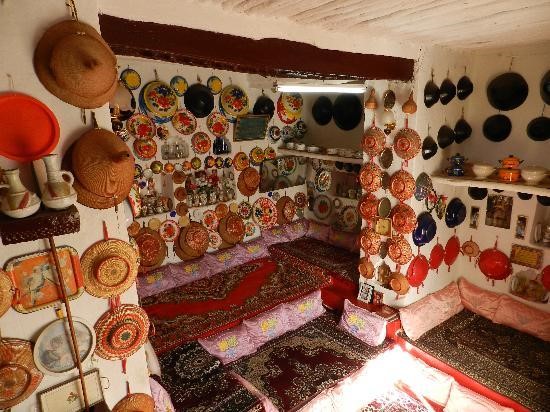
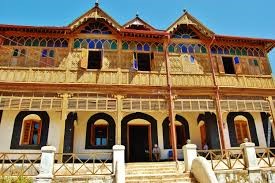
Pictures 1-4 depicting Harar’s cultural heritages and tourist attractions
The main gate known as ‘Duk ber’ is one of the five gates which leads to the walled city ‘Harar Jugol’.A tourist attraction site where a tourist is feeding friendly hyenas.Typical interior of a cultural Harari guest house found inside Harar Jugol.Refurbished 100 years old mansion locally known as ‘Rambo’s house’ and it is said a renowned French poet Arthur Rimbaud once lived inside this house.